
Plan for the Visualization
Uses Plotly for interactivity and Matplotlib/Plotly animations for the dynamic spiral growth.
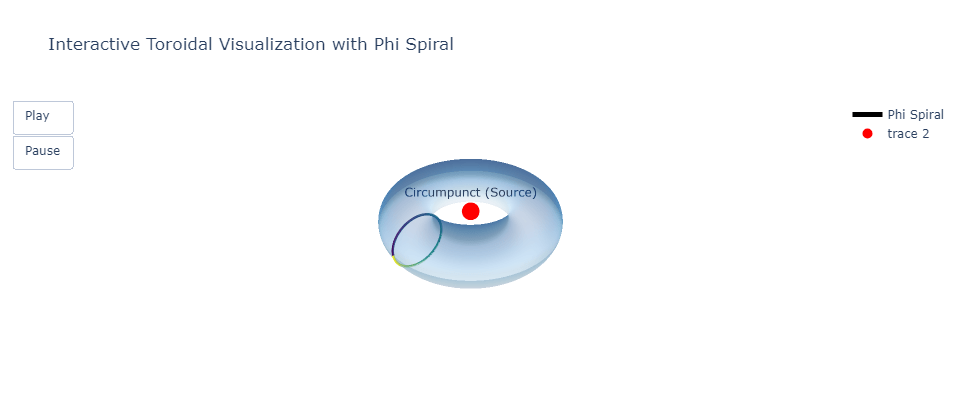
- Base Structure:
- A 3D torus to represent infinite flow.
- The circumpunct at the center to symbolize the source (1).
- Phi Spiral:
- A Golden Ratio (1.161) spiral wraps around the torus.
- Color-coded segments based on their progression or frequency.
- Interactivity:
- Allow zooming, rotation, and tooltips for the spiral to display values (e.g., ratios or frequencies).
- Animation:
- Animate the Phi spiral as it grows outward, dynamically unfolding across the torus.
import numpy as np
import plotly.graph_objects as go

# Parameters for the torus
R = 1  # Major radius (center of torus to tube center)
r = 0.4  # Minor radius (tube radius)
phi_ratio = 1.161  # Golden Ratio
num_frames = 100  # Frames for animation
num_points = 500  # Number of points for spiral
t = np.linspace(0, 2 * np.pi, num_points)  # Angular steps

# Base torus grid
theta = np.linspace(0, 2 * np.pi, 100)
phi = np.linspace(0, 2 * np.pi, 100)
theta, phi = np.meshgrid(theta, phi)
x_torus = (R + r * np.cos(theta)) * np.cos(phi)
y_torus = (R + r * np.cos(theta)) * np.sin(phi)
z_torus = r * np.sin(theta)

# Spiral over torus
x_spiral = []
y_spiral = []
z_spiral = []
for frame in range(num_frames):
    phi_spiral = np.linspace(0, phi_ratio * 2 * np.pi * (frame / num_frames), num_points)
    theta_spiral = np.linspace(0, 2 * np.pi, num_points)
    x = (R + r * np.cos(theta_spiral)) * np.cos(phi_spiral)
    y = (R + r * np.cos(theta_spiral)) * np.sin(phi_spiral)
    z = r * np.sin(theta_spiral)
    x_spiral.append(x)
    y_spiral.append(y)
    z_spiral.append(z)

# Color gradient for the spiral
colors = np.linspace(0, 255, num_points)

# Create frames for the animation
frames = []
for frame in range(num_frames):
    frame_data = go.Scatter3d(
        x=x_spiral[frame],
        y=y_spiral[frame],
        z=z_spiral[frame],
        mode="lines",
        line=dict(color=colors, colorscale="Viridis", width=5),
        name="Phi Spiral",
        hovertext=[f"Frame {frame}, Phi {phi_ratio:.3f}"]
    )
    frames.append(go.Frame(data=[frame_data]))

# Base figure
fig = go.Figure(
    data=[
        go.Surface(x=x_torus, y=y_torus, z=z_torus, opacity=0.5, colorscale="Blues", showscale=False),
        go.Scatter3d(
            x=x_spiral[0],
            y=y_spiral[0],
            z=z_spiral[0],
            mode="lines",
            line=dict(color=colors, colorscale="Viridis", width=5),
            name="Phi Spiral",
        ),
    ],
    frames=frames,
)

# Add circumpunct
fig.add_trace(
    go.Scatter3d(
        x=[0], y=[0], z=[0],
        mode="markers+text",
        marker=dict(size=10, color="red"),
        text=["Circumpunct (Source)"],
        textposition="top center"
    )
)

# Layout adjustments
fig.update_layout(
    scene=dict(
        xaxis=dict(visible=False),
        yaxis=dict(visible=False),
        zaxis=dict(visible=False),
    ),
    title="Interactive Toroidal Visualization with Phi Spiral",
    updatemenus=[dict(type="buttons", showactive=False, buttons=[dict(label="Play",
                                                                      method="animate",
                                                                      args=[None, dict(frame=dict(duration=50, redraw=True), fromcurrent=True)]),
                                                                dict(label="Pause",
                                                                     method="animate",
                                                                     args=[[None], dict(frame=dict(duration=0, redraw=False), mode="immediate")])])],
)

# Save and display
fig.write_html("interactive_toroid_phi_spiral.html")
fig.show()

Sources: InnerIGPT
Stay in the Now within Inner I Network
